
AI Market Insight - Complete Feature Guide
Everything you need to know about your monthly AI-powered market intelligence report
What is AI Market Insight?#
AI Market Insight is a powerful analytics feature inside your ReComAI dashboard. It gives you a deep understanding of your store's market - including product demand, pricing strategy, seasonal trends, and competitor landscape - all generated automatically using AI.
This report is generated once per month. Every new month, a Regenerate button appears so you can get fresh insights. You can also download the full report as a PDF to save or share it with your team.
How to Access It#
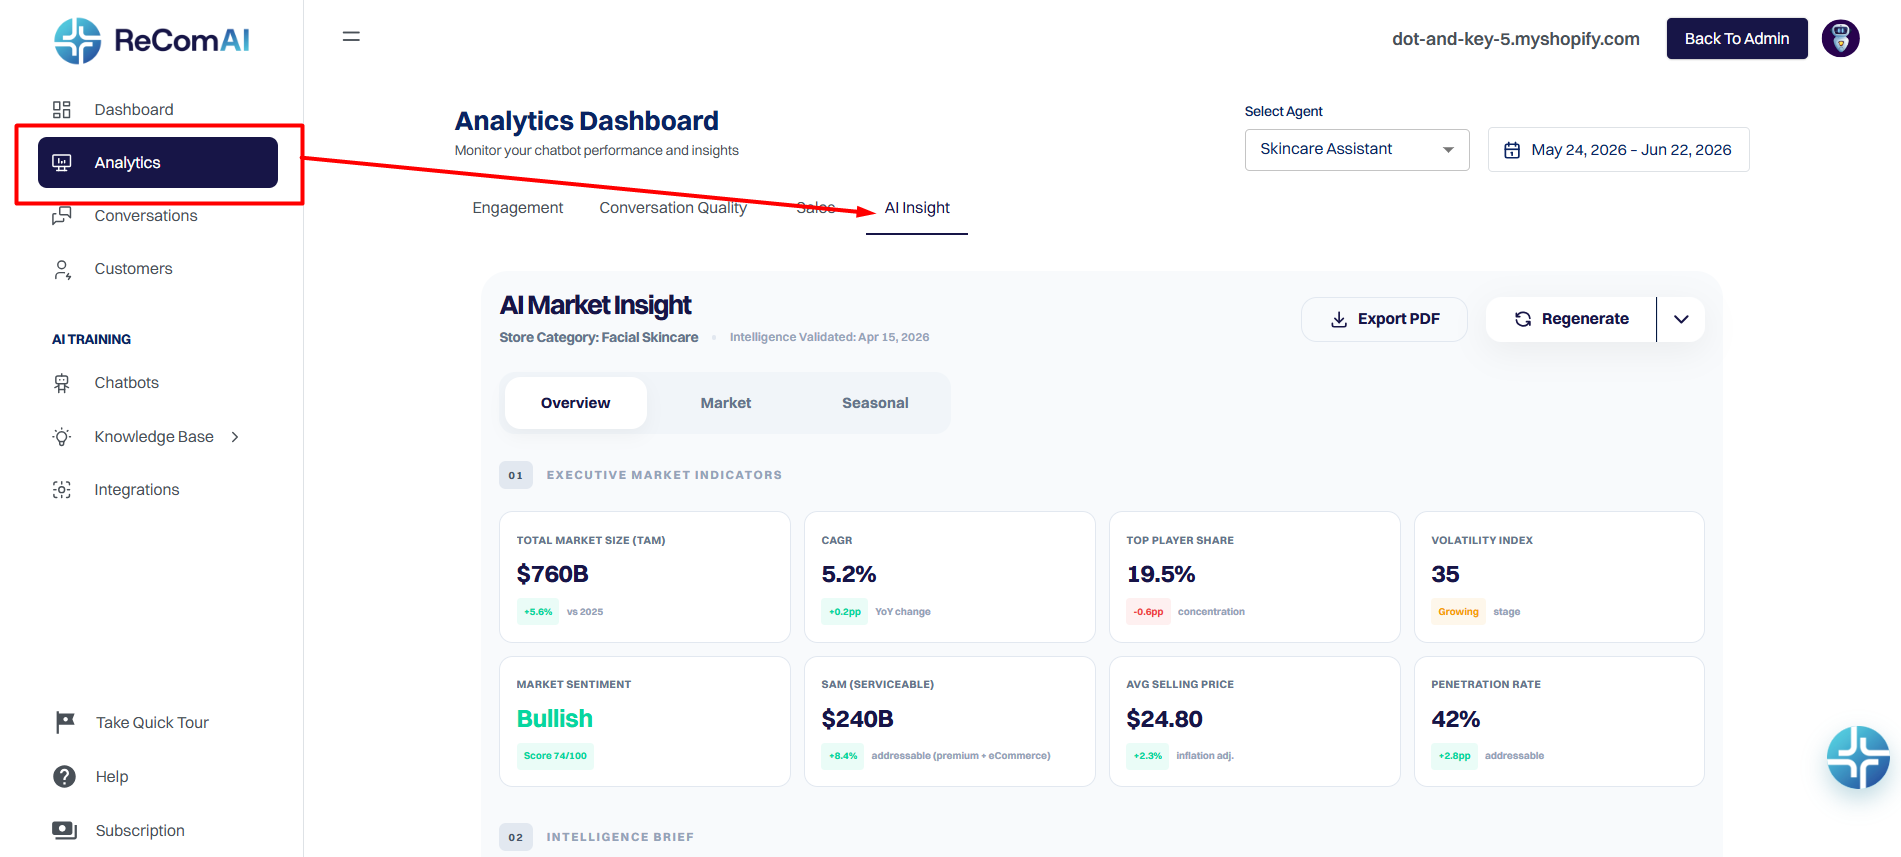
Report Sections - What Each Section Shows#
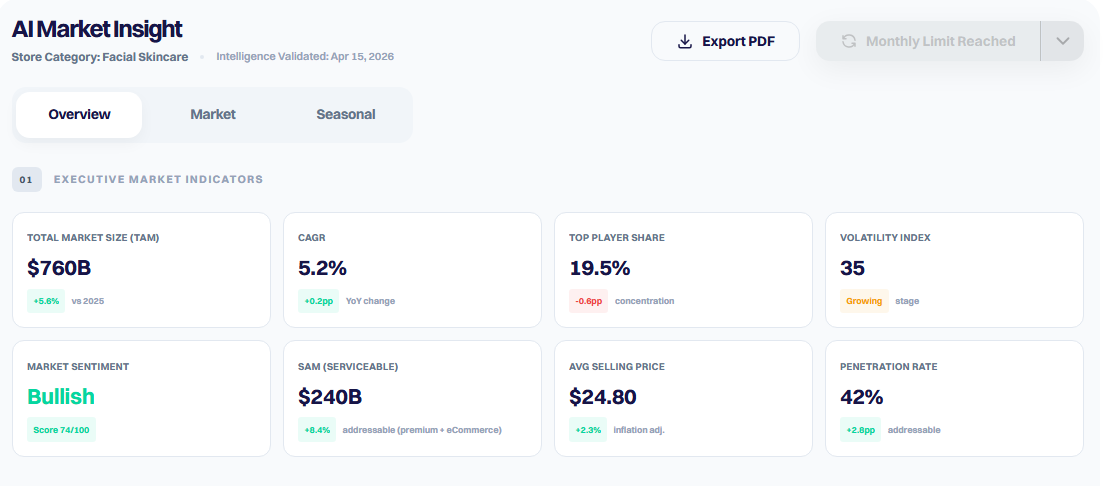
What it is: A set of key market metrics shown as cards at the top of the report. These give you a quick snapshot of your market's health.
What it shows:
Why it matters: These numbers help you understand if your category is growing, what price range customers expect, and how much room there is for your store to grow.
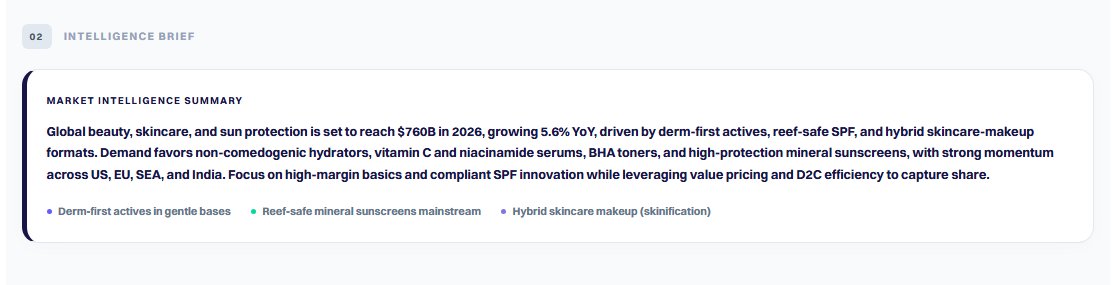
What it is: A written AI-generated summary of your market. It reads like a research brief prepared by an analyst.
What it shows:
Why it matters: Instead of reading 10 different reports, this gives you one clear paragraph that explains exactly what is happening in your market today.
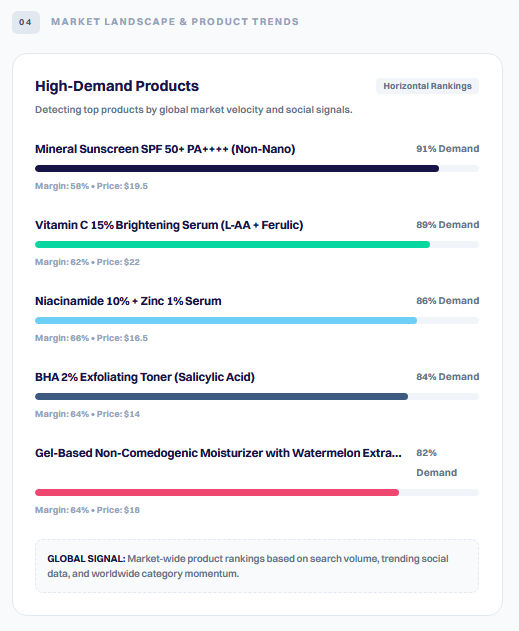
Graph Type: Horizontal Bar Chart
What it shows:
Why it matters: You can see at a glance which of your products have the highest global demand right now. Use this to decide which products to promote, restock, or feature on your homepage.
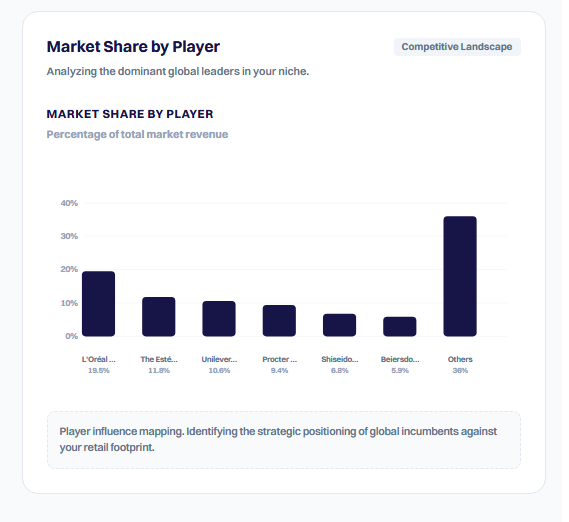
Graph Type: Bar Charts
What it shows:
Why it matters: Understanding who controls the market helps you identify gaps - categories or price points where big players are weak and your store can win.
What it shows:
Why it matters: This list tells you exactly which products customers are searching for most globally. Use it to add new products, adjust inventory, or create targeted campaigns.
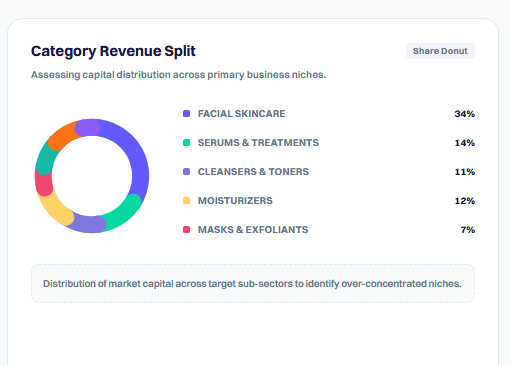
Graph Type: Donut Chart
What it shows:
Why it matters: You can see which sub-categories are generating the most revenue in your market. If your store is missing a high-revenue sub-category, this is where you spot that gap.
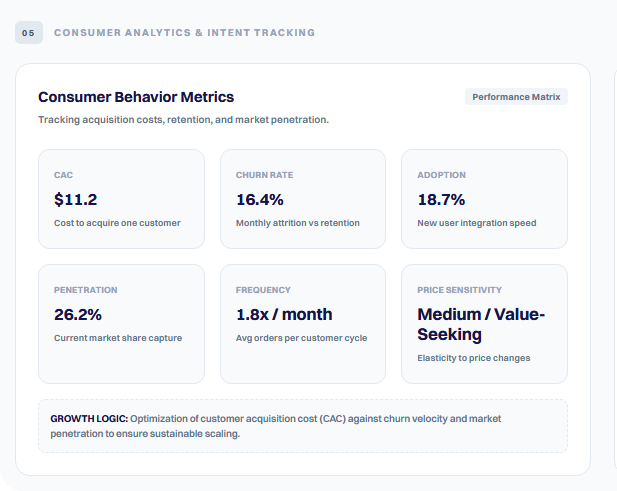
What it shows:
Why it matters: These metrics help you understand your customer's buying behavior - whether they are loyal, price-sensitive, or likely to come back. Use this to plan your retention and pricing strategy.
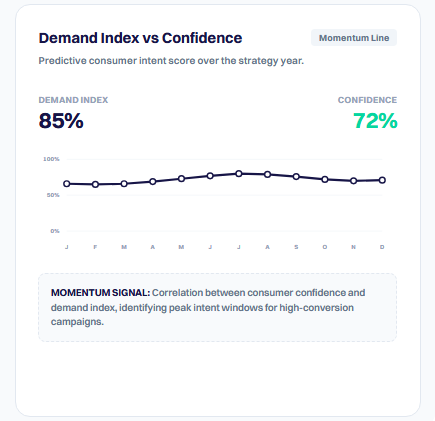
Graph Type: Line Chart
What it shows:
Example: Demand Index 86%, Confidence 73% means demand is very strong and the prediction is fairly reliable.
Why it matters: A high demand index with high confidence means now is a good time to invest in stock and marketing. A low confidence score means the market is unpredictable - be cautious.
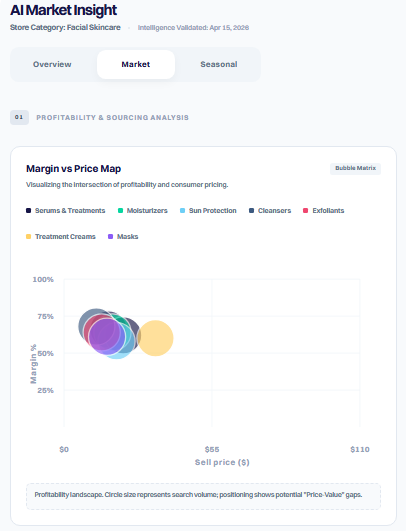
Graph Type: Bubble / Scatter Chart
What it shows:
Why it matters: This chart helps you find the sweet spot - products that have high margin AND high search volume at a price customers are willing to pay. Products in the top-right zone are your best opportunities.
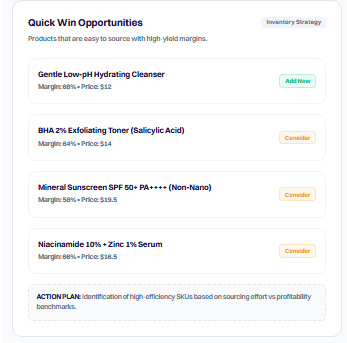
What it shows: A curated list of products that the AI has identified as easy wins - products with:
Each product is tagged as Optimize, Promote, or Expand based on what action you should take.
Why it matters: This section removes guesswork. The AI tells you directly which products you should focus on right now to get the fastest results.
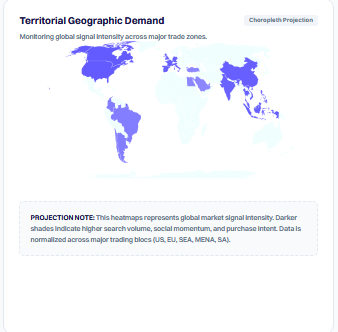
Graph Type: Choropleth World Map
What it shows:
Why it matters: If you are considering international shipping or running global ads, this map shows you exactly where your customers are. Focus your marketing budget on high-demand regions.
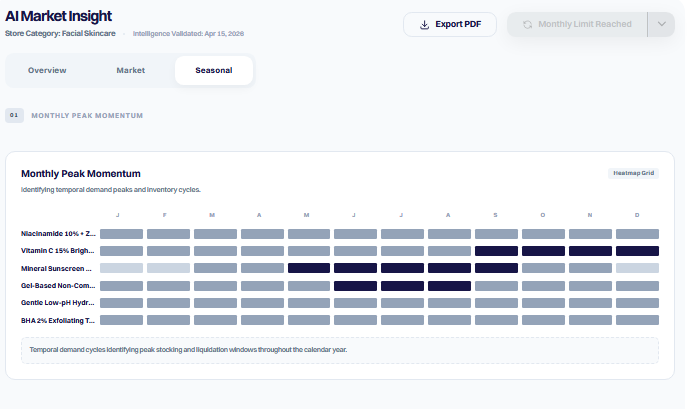
Graph Type: Heatmap Grid
What it shows:
Example: 18K Gold-Plated Waterproof Huggie Hoops show peak demand in April, May, October, November, December.
Why it matters: Plan your inventory and campaigns around peak demand months. Stock up before high-demand months and avoid overstocking during low-demand periods.
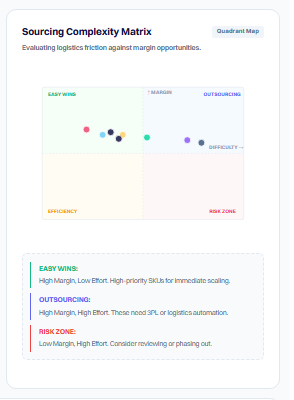
Graph Type: Quadrant Scatter Chart
What it shows:
Why it matters: This matrix helps you make smarter sourcing decisions. Focus on products in the top-left zone - they give you the best return with the least sourcing headache.
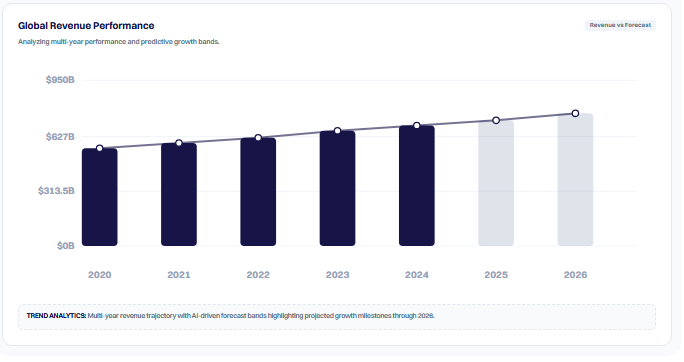
Graph Type: Bar + Line Chart
What it shows:
Why it matters: See whether your market is growing or shrinking over time. A consistent upward trend confirms you are in a healthy and expanding category.
Monthly Limit & Regeneration#
Export Your Report
Need Help?
If you have questions about your AI Market Insight report or need help understanding any section, our support team is here.
👉 Use the chat widget on your screen to talk to us 👉 Email us at: hello@recomai.one