ReComAI Analytics Dashboard Guide
Understand chatbot performance, engagement, and sales insights using the Analytics dashboard
The ReComAI Analytics Dashboard provides a detailed overview of your chatbot’s performance and user interactions. It helps you understand how users interact with your chatbot and how effectively the chatbot supports your business.
Using the analytics data, you can analyze different aspects of chatbot activity, such as:
Conversations between the chatbot and users
User engagement levels
Sales-related interactions
Customer support queries
Frequently asked questions
Feedback on chatbot responses
This information helps you better understand your chatbot’s performance and identify areas where you can improve responses or update your knowledge base.
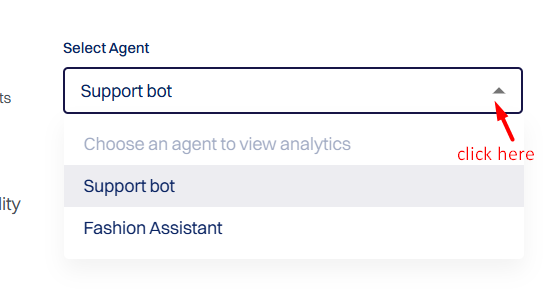
If you have multiple chatbots configured, you can use the Select Agent option to view analytics for a specific chatbot.
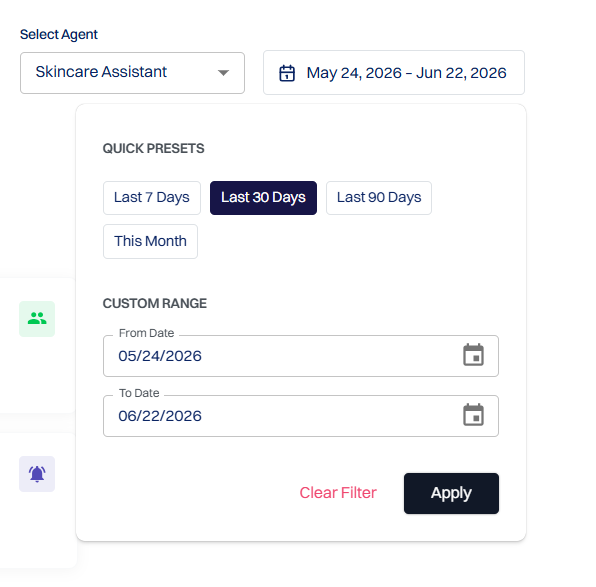
Choose a predefined time period using the Quick Presets options (Last 7 Days, Last 30 Days, Last 90 Days, or This Month), or select a custom date range using the From Date and To Date fields. Click Apply to update the analytics, or use Clear Filter to reset the selected filters.
Analytics Dashboard Tabs
The ReComAI Analytics Dashboard is divided into different sections to make it easier to analyze chatbot performance from multiple perspectives.
The Analytics section includes the following tabs:
Engagement
Conversation Quality
Sales
AI Insights
Each tab provides insights into a different type of chatbot activity.
Path:
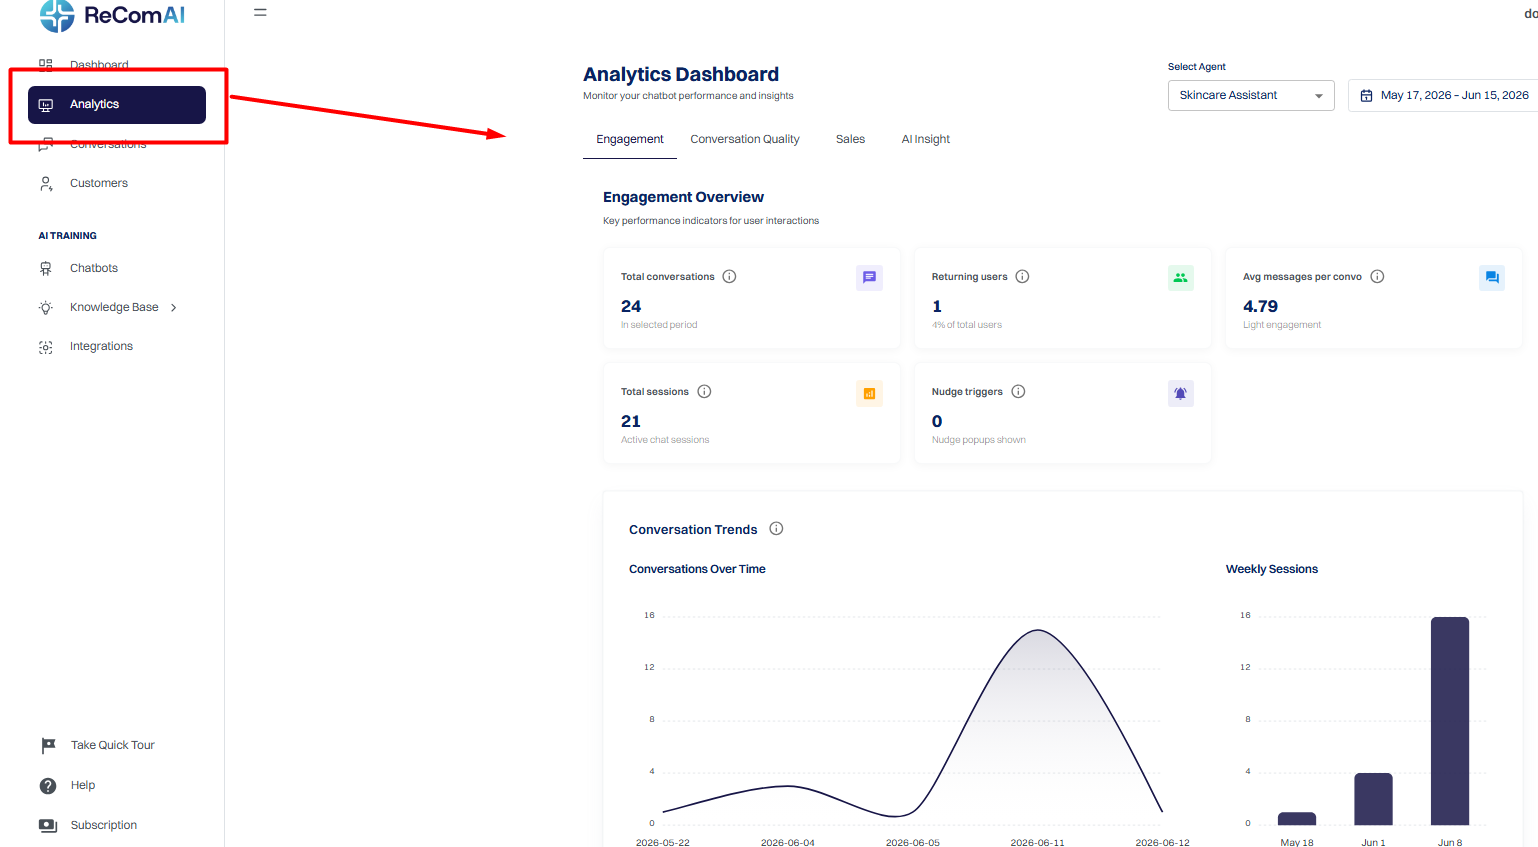
ReComAI Dashboard → Analytics → Engagement Tab
1.Engagement Tab
The Engagement Tab displays key interaction metrics that help you understand overall chatbot performance.
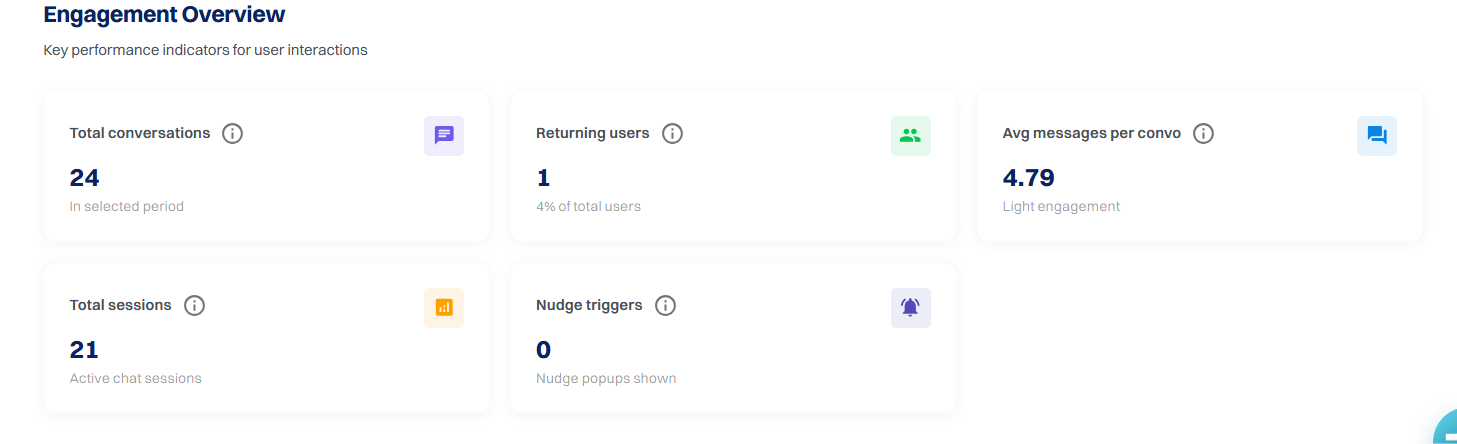
Total Conversations
This metric shows the total number of conversations between users and the chatbot during the selected time period.
Every time a user starts interacting with the chatbot, it is counted as a conversation.
This helps you understand:
How often the chatbot is being used
How frequently users interact with it
Returning Users
The Returning Users metric shows how many users came back and interacted with the chatbot again.
This helps you understand:
Whether users find the chatbot useful
Whether users are returning to interact with it again
A higher number of returning users usually indicates a better user experience.
Average Messages per Conversation
This metric shows the average number of messages exchanged in a single conversation.
It helps you understand how detailed the conversations are between users and the chatbot.
A higher number may indicate that:
Users are asking detailed questions
The chatbot is successfully engaging users
Total Sessions
The Total Sessions metric shows how many times users opened the chatbot and started interacting with it.
A session is counted when:
A user opens the chatbot
A conversation begins
This helps you understand how frequently the chatbot is being accessed.
Nudge Triggers
The Nudge Triggers metric shows the total number of AI nudges displayed to users during the selected time period.
This helps you understand:
How often AI nudges are shown to visitors
How proactively the chatbot engages users
The effectiveness of your engagement strategy
A higher number of nudge triggers indicates increased proactive user engagement and more opportunities to encourage customer interaction.
2.Conversations Over Time
This section includes a graph showing the number of conversations over the selected time period.
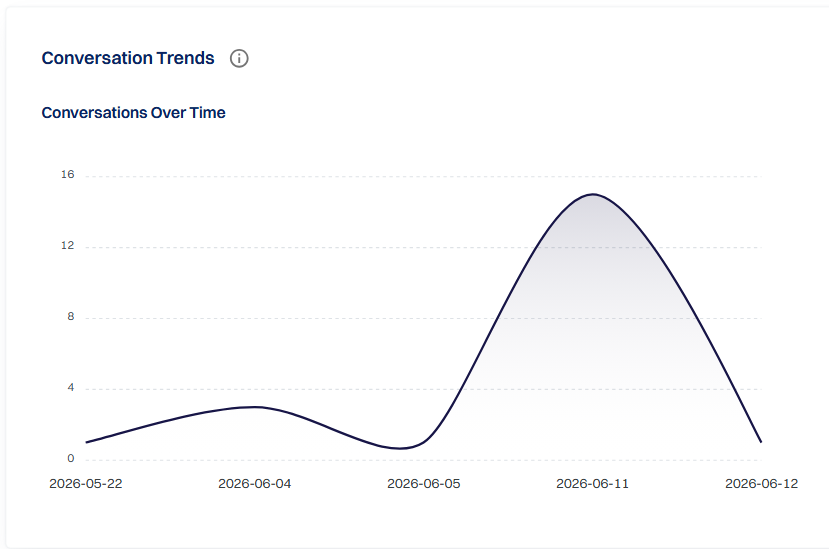
With this graph, you can easily identify:
Which days the chatbot was used the most
Trends in user engagement
Growth or decline in chatbot usage
This information can help you analyze user behavior and marketing campaign performance.
Weekly Sessions
The Sessions Distribution chart provides a visual overview of the total chatbot sessions.
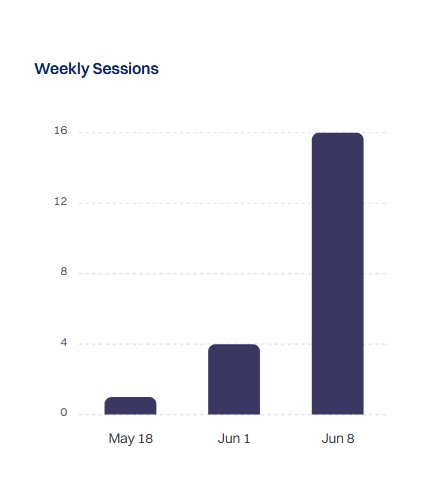
It helps you understand how often users are accessing the chatbot and the overall volume of interactions.
This data is useful for evaluating the chatbot’s engagement level.
Engagement by Country
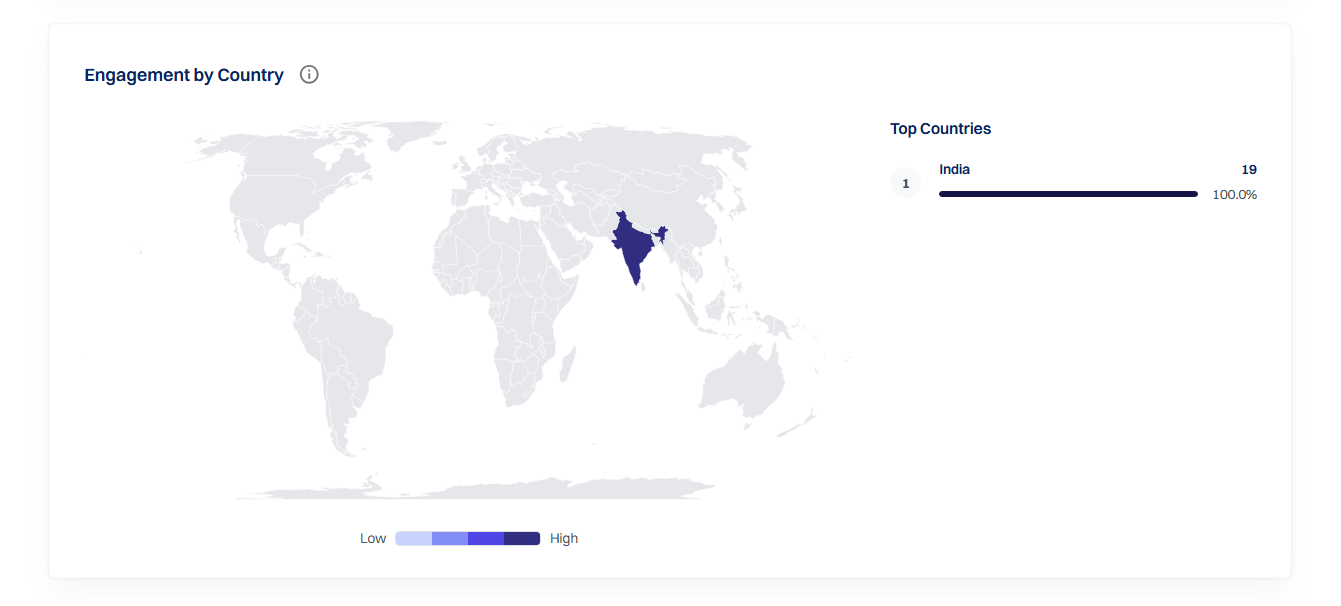
The Engagement by Country section displays a world map showing where your chatbot interactions are coming from. Countries with more chatbot activity are highlighted with darker colors, making it easy to identify regions with higher engagement.
This helps you:
Identify which countries generate the most chatbot interactions.
Understand your audience's geographic distribution.
Measure engagement levels across different regions.
The Top Countries panel on the right lists the countries with the highest chatbot engagement, along with the total interactions. The color scale at the bottom ranges from Low to High, helping you quickly visualize engagement intensity across the map.
Top Keywords
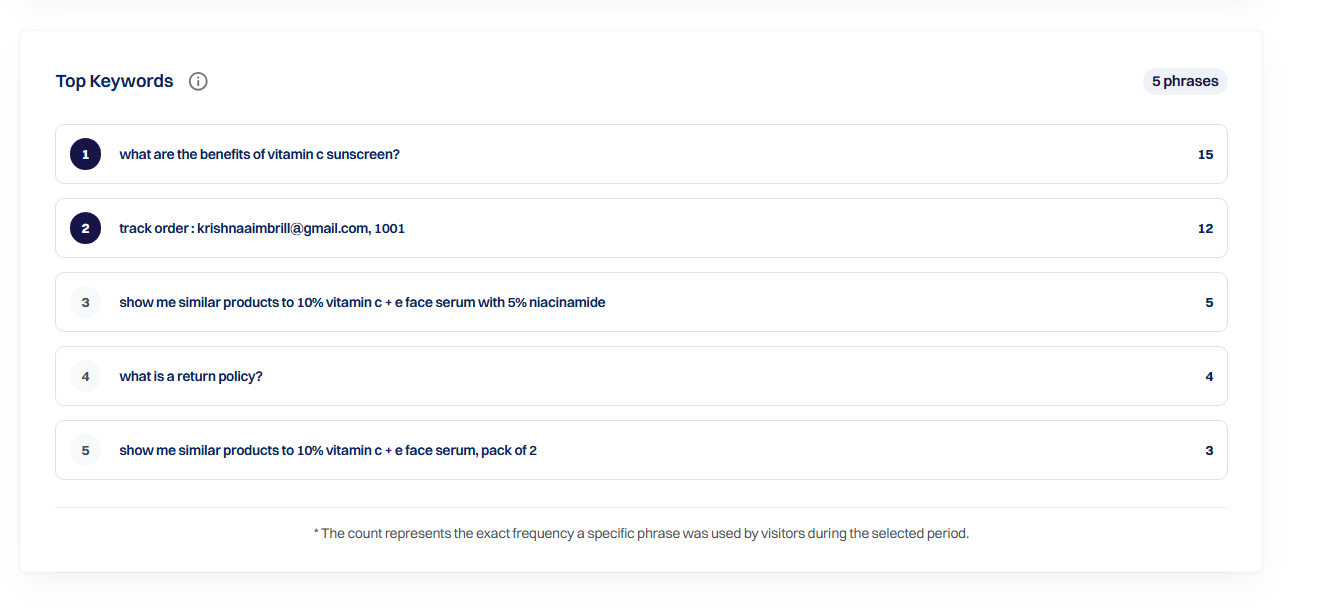
The Top Keywords section shows the most common keywords or queries users ask the chatbot.
These keywords are automatically generated based on user conversations.
This information helps you:
Identify common customer questions
Improve your knowledge base
Prepare better product recommendations
If certain keywords appear frequently, you can add better responses or related knowledge base content.
2.Conversation Quality Tab
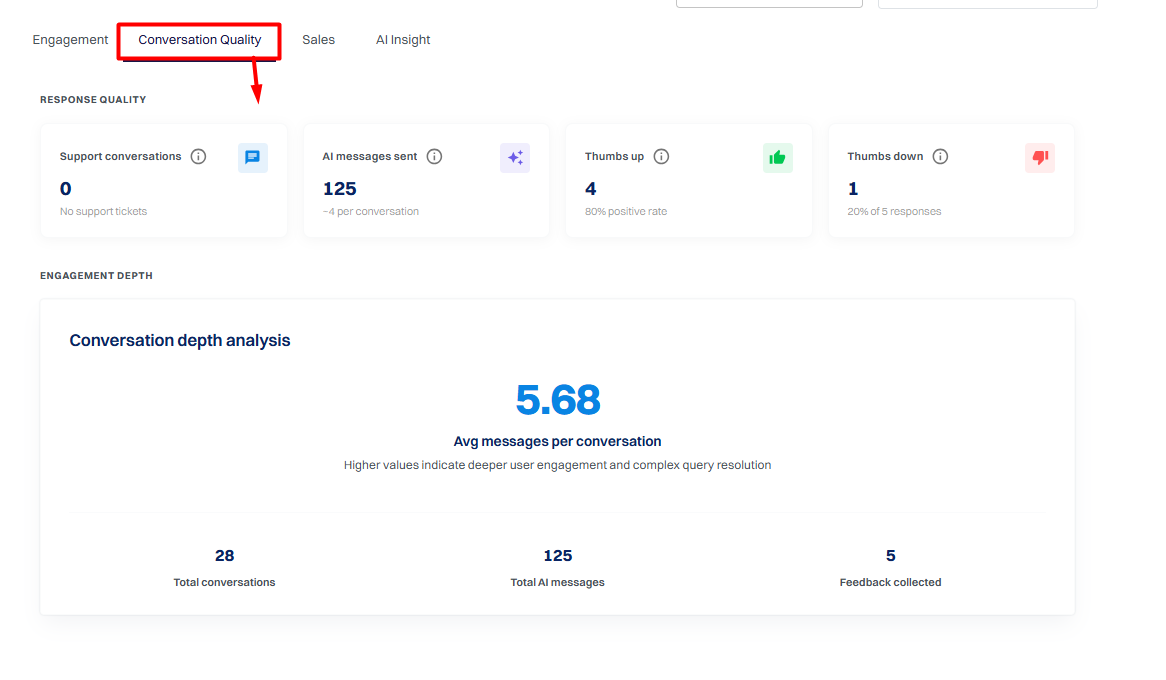
The Conversation Quality Tab provides insights into the quality of interactions between the chatbot and users.
It helps you understand how effectively the chatbot responds to user queries and how users react to those responses.
You can use the Select Agent option to analyze conversation quality for a specific chatbot.
You can also use the Select Time Period option to view data for a specific time range.
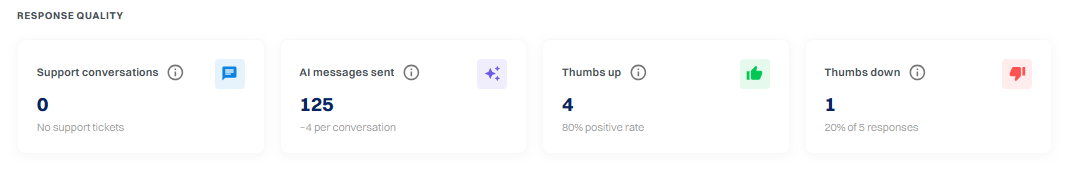
Support Conversations
This metric shows the number of conversations where users requested human support during the selected time period.
Support requests may occur when:
The chatbot cannot fully resolve a query
The user requests assistance from a human agent
This metric helps you understand both chatbot performance and how often users require human help.
AI Messages Sent
This metric shows the total number of AI-generated responses sent by the chatbot to users.
It helps you understand:
How active the chatbot is
How often the chatbot responds to user queries
This metric is useful for analyzing overall chatbot usage and interaction levels.
Thumbs Up Messages
The Thumbs Up Messages metric shows how many positive feedback reactions users gave to chatbot responses.
This indicates that users found the response helpful.
Thumbs Down Messages
The Thumbs Down Messages metric shows how many negative feedback reactions users gave to chatbot responses.
This helps identify areas where chatbot responses may need improvement.
Conversation Depth Analysis
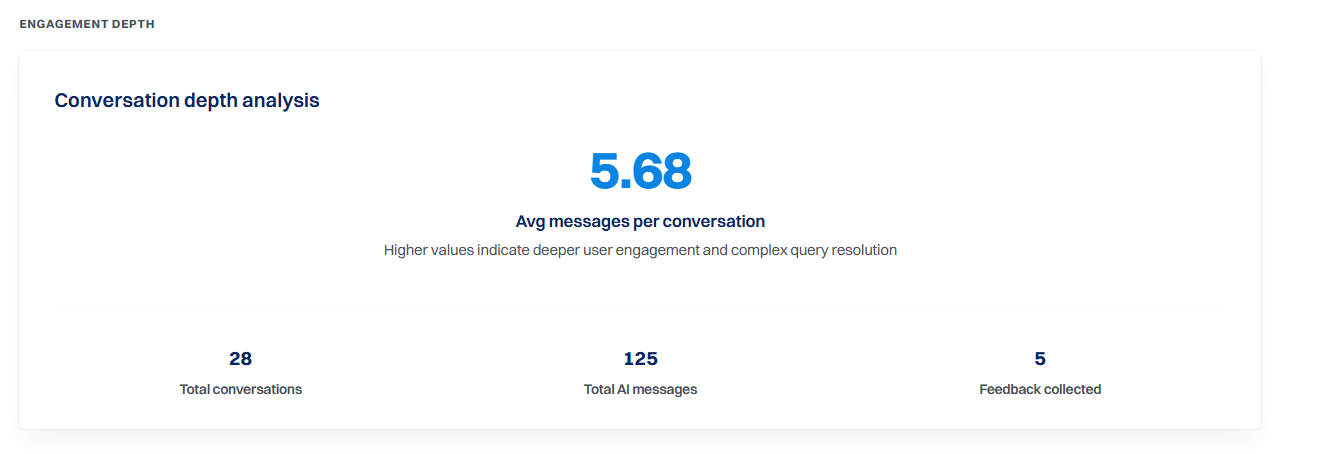
The Conversation Depth Analysis section helps you understand how deeply users interact with your chatbot during conversations.
The main metric displayed is Average Messages per Conversation, which shows the average number of messages exchanged in each chat session.
A higher value generally indicates that users are having longer, more meaningful conversations and that the chatbot is effectively assisting with their queries.
Below the average, you'll also find additional engagement metrics:
Total Conversations – The total number of conversations started during the selected period.
Total AI Messages – The total number of responses generated by the AI across all conversations.
Feedback Collected – The number of user feedback responses (such as thumbs up or thumbs down) received for chatbot replies.
These metrics help you measure overall engagement, understand conversation quality, and evaluate how effectively your chatbot is interacting with users.
3.Sales Tab
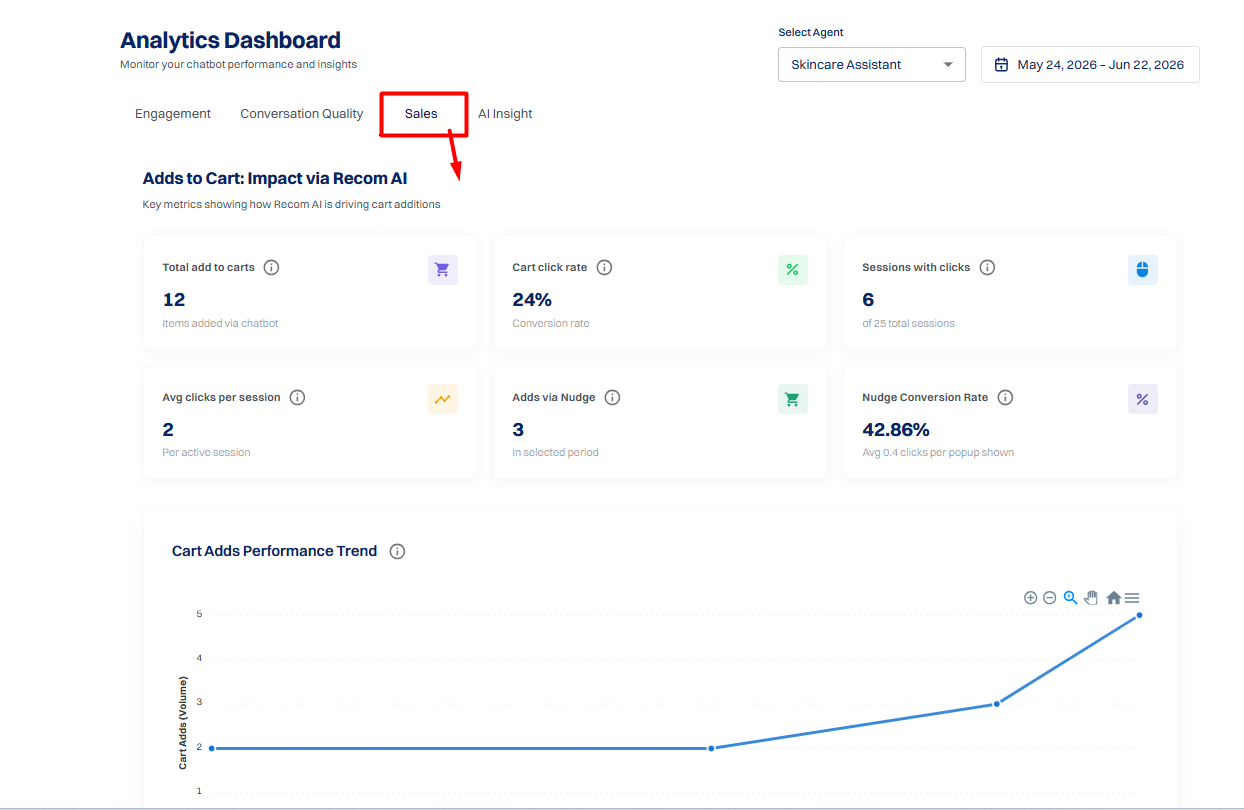
The Sales tab helps you understand how your chatbot contributes to product discovery, Add to Cart actions, and overall sales engagement.
You can use the Select Agent option to analyze the performance of a specific AI agent and the Date Range filter to view analytics for a selected time period.
Adds to Cart: Impact via ReComAI
This section provides an overview of how ReComAI influences product interactions and Add to Cart actions.
The metrics help you understand how effectively your chatbot encourages users to engage with products and move closer to making a purchase.
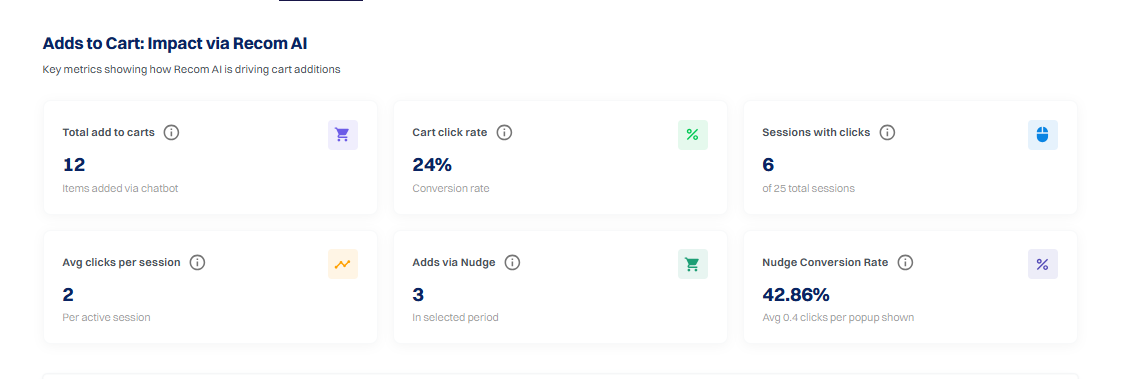
Total Add to Carts
Displays the total number of products added to the cart through chatbot interactions during the selected period.
This metric shows the chatbot's direct contribution to the shopping journey.
Cart Click Rate
Shows the percentage of sessions in which users clicked Add to Cart after interacting with the chatbot.
A higher Cart Click Rate indicates that the chatbot is successfully encouraging users to take action.
Sessions with Clicks
Displays the number of chatbot sessions where at least one Add to Cart click occurred.
This helps you understand how many user sessions resulted in product engagement.
Avg Clicks per Session
Shows the average number of Add to Cart clicks generated during a single chatbot session.
Higher values indicate stronger user engagement with product recommendations.
Adds via Nudge
Displays the number of Add to Cart actions generated through chatbot nudges or proactive product recommendations.
This helps measure how effectively nudges encourage users to add products to their cart.
Nudge Conversion Rate
Shows the percentage of nudge impressions that resulted in an Add to Cart action.
A higher conversion rate indicates that your nudges are relevant and effective.
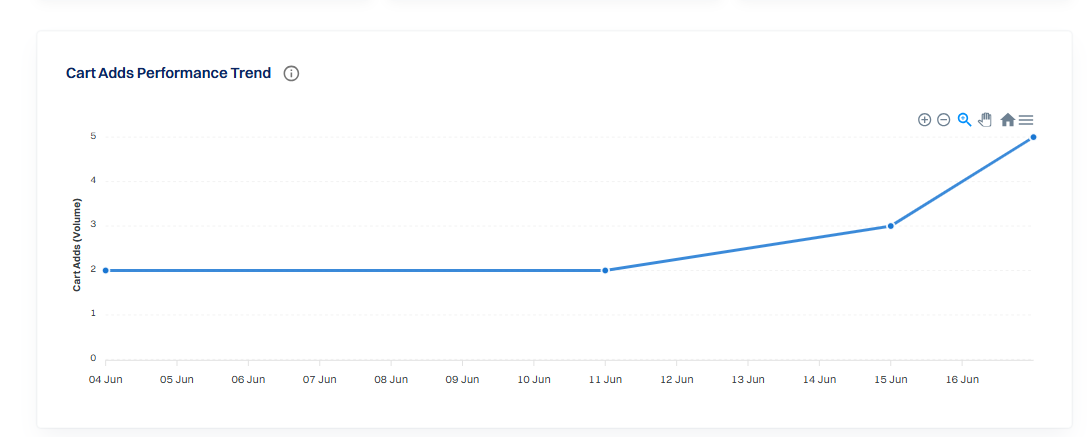
Cart Adds Performance Trend
This graph displays Add to Cart activity over the selected time period.
It helps you:
Track Add to Cart trends over time
Identify high-performing dates
Monitor changes in user engagement
Measure chatbot-driven sales performance
The chart provides a clear view of how product engagement changes over time.
Performance & Growth
This section compares current performance with previous activity to help you measure sales growth.
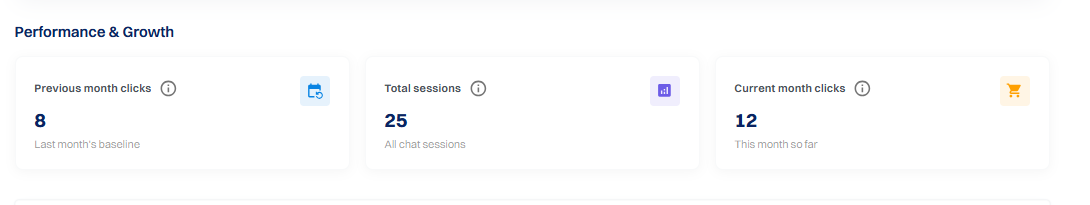
Previous Month Clicks
Displays the total Add to Cart clicks recorded during the previous month.
Use this metric as a baseline for performance comparison.
Total Sessions
Shows the total number of chatbot sessions during the selected period.
This represents the total opportunities the chatbot had to influence user purchasing behavior.
Current Month Clicks
Displays the total Add to Cart clicks recorded during the current month.
Comparing this with the previous month's data helps you evaluate sales growth.
Recent Cart Click Sessions
This section lists the most recent chatbot sessions where users clicked Add to Cart.
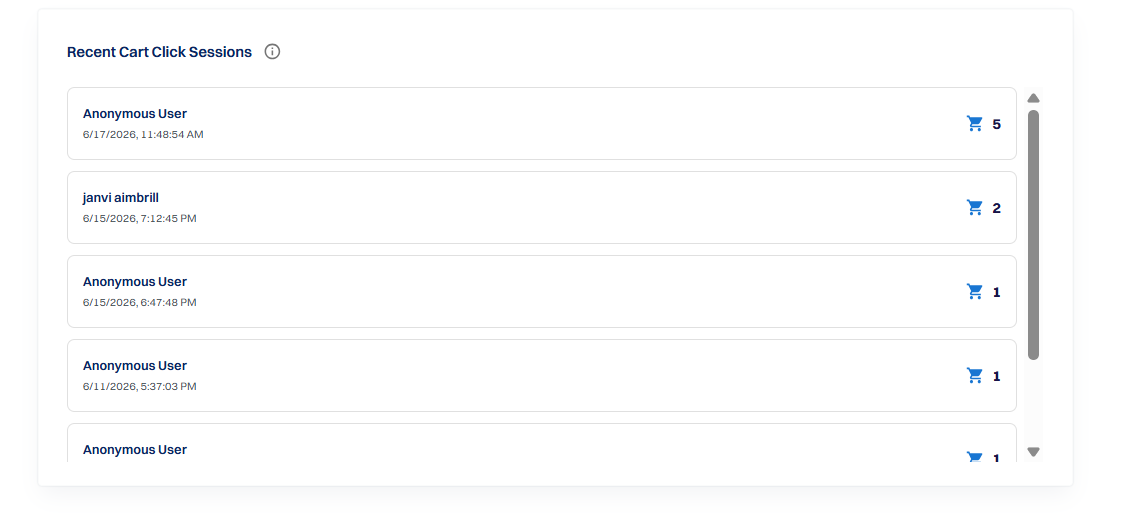
For each session, you can view:
User name (or Anonymous User)
Date and time of the interaction
Number of Add to Cart clicks during that session
This information helps you monitor recent customer activity and understand how users interact with product recommendations generated by the chatbot.
Summary
The ReComAI Analytics Dashboard helps you track how users interact with your chatbot and how it contributes to engagement, support, and sales. By analyzing metrics across different tabs such as Engagement, Conversation Quality, and Sales, you can understand chatbot performance, user behavior, and conversion trends.
These insights help you improve chatbot responses, optimize product recommendations, and enhance the overall customer experience.